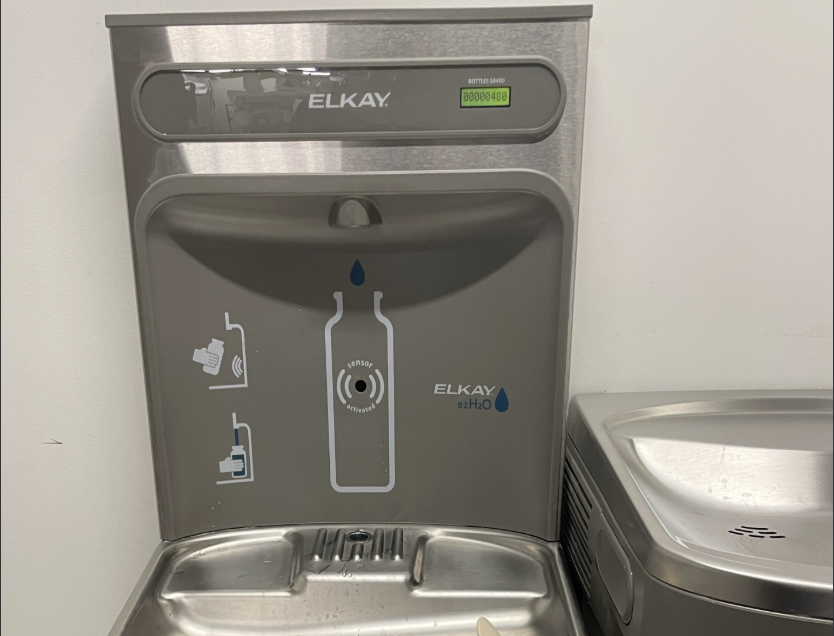
This activity is designed to introduce students to key graphing and prediction skills used in physics. Students use familiar phenomena, such as drinking fountain data, to create their own graphs and analyses and make predictions about what a water bottle reader will show over time. Through this activity, students practice identifying patterns, understanding relationships between variables, and building simple mathematical models while seeing how physics develops quantitative reasoning skills that can be applied beyond science to areas such as behavior, finance, and economics.
Grade Levels: 9-12
Educational Standards
NGSS:
SEP 5: Using Mathematics and Computational Thinking
AP Physics Science Practices:
1. Creating Representations – 1.B; 1.C
2. Mathematical Routines – 2.C; 2.D
Topics: Physics, Data Science, Computational Thinking
Contributor: Joe Bartin, Kirkwood High School
Acknowledgements: The contents of this curriculum were co-developed with Principal Investigator Professor Mikhail Tikhonov in Physics at WashU and funded by a grant from the National Science Foundation (CAREER: Harnessing emergent simplicity for high-precision predictions in high-diversity microbial ecosystems, PHY-2340791). These contents do not necessarily represent the policies of the National Science Foundation, and you should not assume endorsement by the federal government.